Streaming Growth
in Oscars
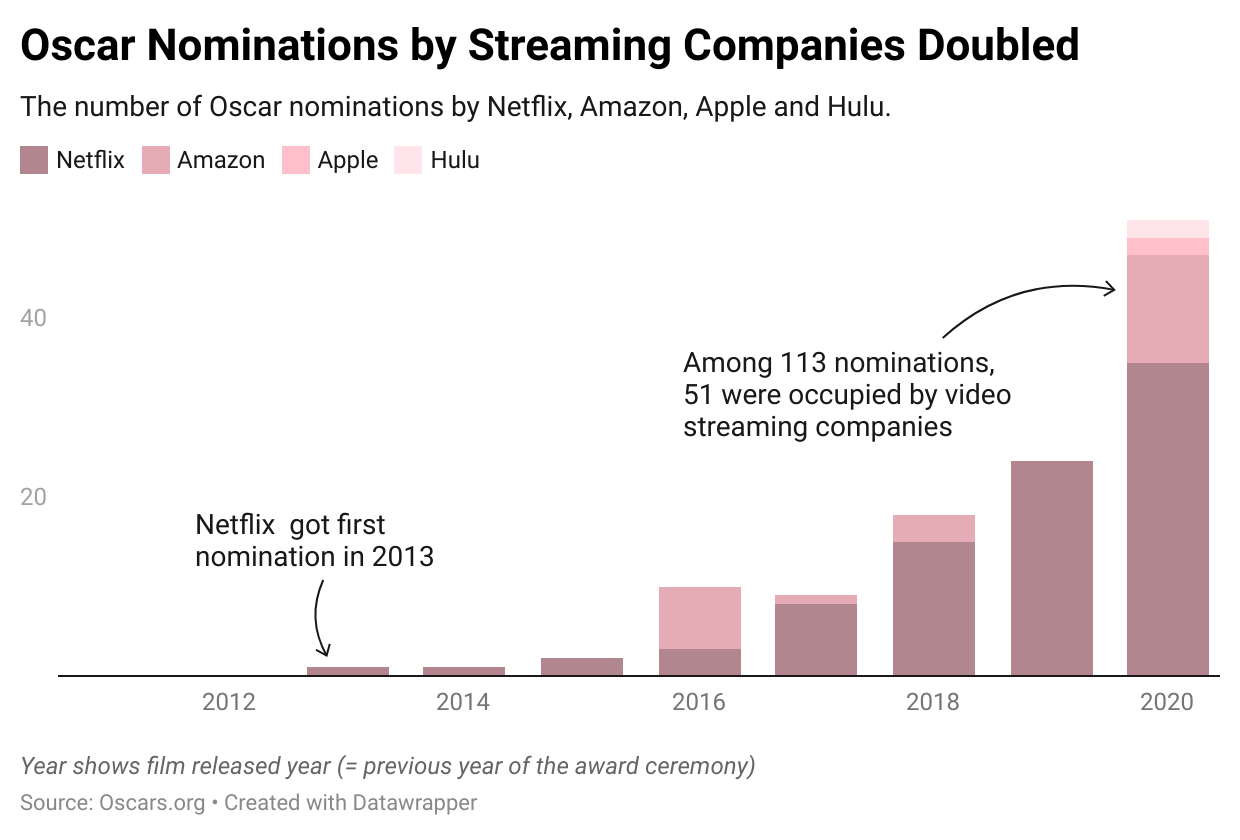
Films from streaming companies occupied 45% of all nominations among 2020 Oscars.
March 9, 2020, was distinctly different from a regular Monday. The 101 traffic jam had suddenly disappeared from the San Francisco bay area because major technology companies asked employees to work from home. A cruise ship urgently arrived at the Port of Oakland that afternoon due to a suspected coronavirus outbreak. The following week, the city and state made stay-at-home orders. As you all know, the crazy days began.
COVID-19 destroyed our everyday life. So technology became our lifeline. I bought everything online instead of shopping at stores. The movie theater closed its door, then I watched Netflix. We started using Zoom frequently to stay connecting with friends and colleagues.
Over a year has passed since then. I am trying to figure out what temporary changes and permanent changes are. I often picked subjects and datasets related to technology and our life in the COVID era for weekly projects in the Lede.
For example, Amazon's warehouses have increased throughout the 2010s, but we can see that the pace accelerated in 2020 and 2021. It indicates online shopping became more popular than before and probably continues to grow. (I also analyzed the relation between warehouse locations and racial compositions in the area but found no clear correlation.)
I used Tika to read the png file of the table —disclosed by the data source. It was awful. I cleaned it with regex and so much manual work. I also check some regional news reports to fix the wrong number put on the original dataset.
Films from streaming companies occupied 45% of all nominations among 2020 Oscars.
For streaming, I analyzed the Oscar nominations using the Award database operated by Oscars.org. The number of 2020 nominations by streaming companies was doubled from the previous year and occupied 45% of all nominations based on my analysis. I understand some arguments there, but I used the traditional way to classify "streaming company." (So I didn't count Walt. Disney as a streaming company, even I watched "Soulful World" online.)
We also saw an acceleration of IPOs. The successes of Zoom and the digital transformation trend gave young companies the confidence to go public. I tried to figure out the density of IPO companies with Hexbin analysis on QGIS. SF bay area and Boston (the center of biotech) are leading recent IPOs.
Note :
I used df = df[ df['columns'] != SPAC]on the way of data cleaning, so all SPACs are excluded from my analysis.
Note:
I set the hexagon's short diagonal as 160km because Sam Altman tweeted, "a large fraction of the most important US companies started in the next decade will continue to be within 50 miles of SF." These are almost the same area.
These three examples are a testament to the strength of technology companies that even COVID has become a tailwind. However, what I feel as an immigrant living in the corner of the Valley is more of a backlash. The more they grow, the more regulators in Washington. DC looks at them severely. This trend has started after the 2016 election, but the backlash seems to get bigger as COVID has widened the gap. Companies that used to say "Make the world a better place" or "Don't be evil" seem to make efforts on building relationships with governments.
So for my final-final-final project, I decided to analyze "the price of strength." One of the sources that show the relationship between corporations and politics are reports on lobbying expenditures. Though the Center for Responsive Politics organization continuously tracks data about lobbying activity, I tried obtaining raw data from the Senate website this time.
Senate offers us lobbying API, but it's not so good. I decide to scrape information on lobbying expenditure and links to documents themselves. I chose the five big names in the technology industry; Amazon, Apple, Google (Alphabet), Facebook, and Microsoft. (Some people prefer to choose Big 4 instead of 5, but more is always better.)
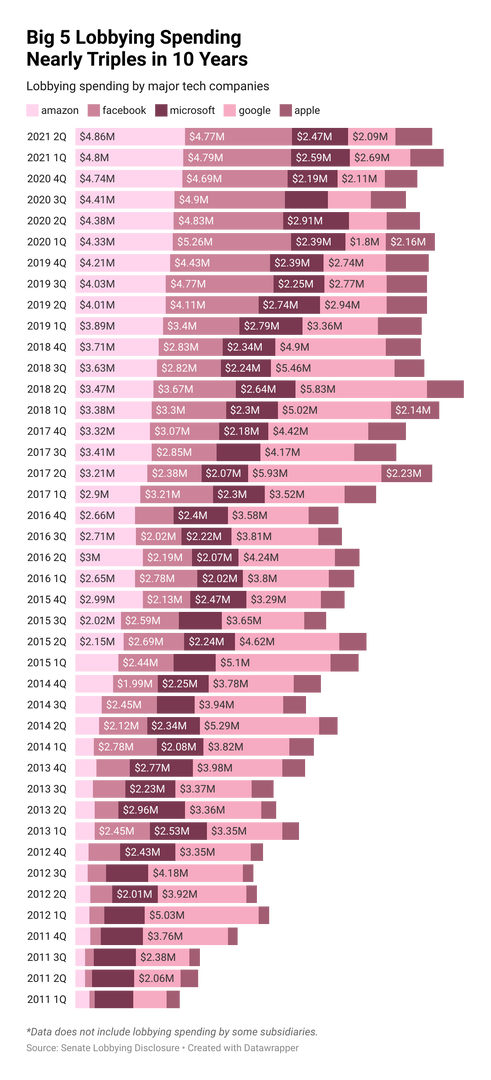
The first step is getting the table. Thanks to the simple Senate website and ".read_html," I obtained each company's table of historical lobbying expenditures. I also scraped the URLs to filling documents (PDF) with Beautiful Soup. Lobbying data is typically quarterly basis.
Based on data I obtained, the lobbying expenditures of the Big 5 roughly tripled past ten years. For example, the sum of their spending was $ 15.8 million in 2Q 2021. If you see just Amazon, its lobbying expenditure increased more than ten times past a decade, while Facebook 15 times.
Note:
My scraped data doesn't include some of the subsidiaries of these companies.
The actual amount of expenditure may be more.
Note:
About "amendment," I kept both the original one and amendment on the data frame. Because sometimes amendments include essential information, it's worth checking manually. Then I reflected on it.
Next, I moved to PDF parsing. Using links I got from the Senate website, I parsed two elements from PDF. One is the three letters of the alphabet called "general issue area code." For example, TEC stands for telecommunications. We can find out BigTech's interested area via these codes. The document also has contents titled "Specific lobbying issues." When we read this, we can understand the details of lobbying.
I know older documents have a different format. I focused on documents submitted after 2011. Five companies, quarterly basis, ten years means 200 PDFs. It's enough!
Some interesting facts came to light. For Amazon and Facebook, where there was a noticeable growth in expenditure, the issues areas covered by the lobby also expanded.
For example, in 2Q 2021, Amazon was lobbying for 23 areas, including CAW(Clean Air and Water = climate change-related issue) and BUD(Budget = government procurement, they mentioned cloud computing). The number of issue areas tripled past ten years. Facebook added CIV (Civil Rights) to its issue portfolio in 2019. The company has mentioned "hate speech" as a specific issue in this area.

The other three companies have a less significant change than Amazon and Facebook. However, we found some minor changes. Microsoft added DEF (Defence) in 2021 and mentioned quantum computing. Apple did lobbying about voting rights (code is CIV = Civil Rights). I created a few data frames to check specific issues and area code on the way of analysis. (it was not perfect, but it worked for reference purposes)
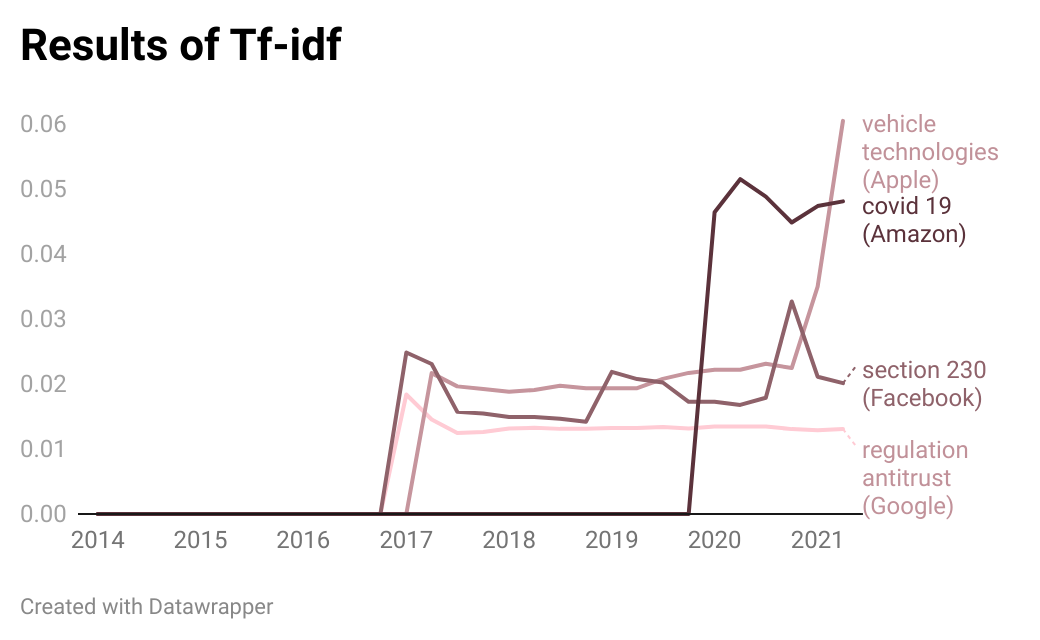
I also tried using TfidfVectorizor from Scikit-learn to look for frequently used words. If some terms' frequency has increased in recent years, it's worth seeing.
Honestly, the first results were awful. Thorough setting some stop words and n-grams, the feature words list now became at least a human-readable one. I feel I should need to customize it more based on the uniqueness of lobbying documents.
But I could find some exciting words/phrases in the list of 100 feature words, sorted by the score in the latest quarter. Google quoted "regulation antitrust" while Facebook mentioned "section 230", Microsoft referred to "facial recognition." There all are controversial topics lawmakers are focusing on.
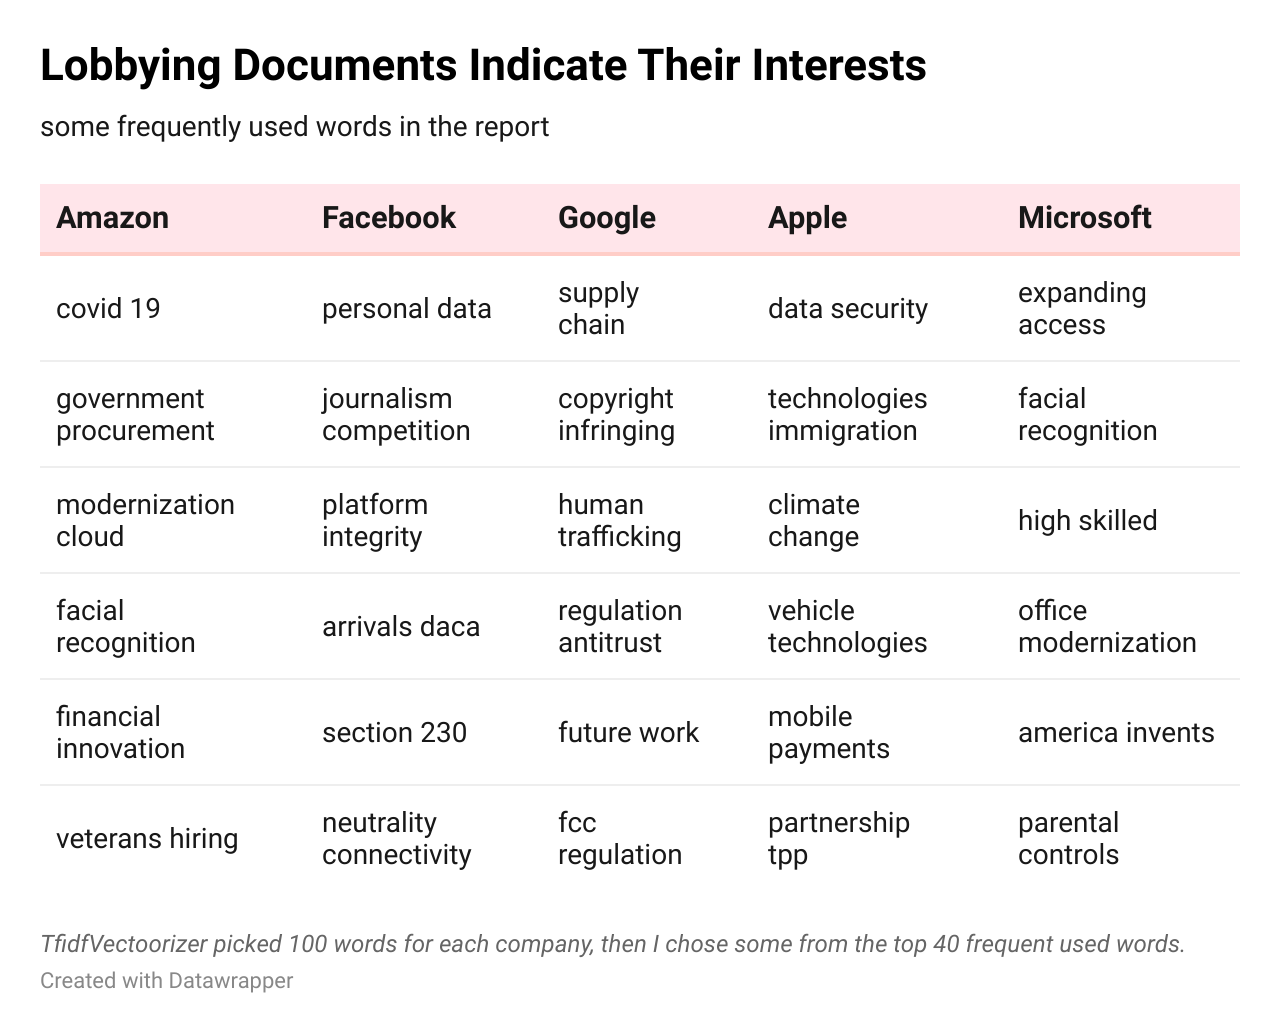
Amazon's mention of "covid 19" reflects its business and challenges (preventing infection in warehouses is critical for the company). Apple talked about "vehicle technologies." It indicates some future business, maybe.
I'm still learning how to use sci-kit learn appropriately in my work. I don't want to use these results directly in my article at this moment, but it might give me some hints before reading the 200 PDF documents.
Note:
For Tf-idf Vectorizer I set ngram_range = (2,2), some stop words such as [fy','year','fiscal'...]
Because of the outbreak of the Delta-variant, the end of the COVID tunnel is still far away. It will further show the strength of tech companies and create more arguments and hatred.
I continue to watch what is going on with the knowledge I got through Lede 2021.
created with
Website Builder Software .